API performance— Spring MVC vs Spring Webflux vs Go
This is a demonstration, comparing throughput on backend application running on Spring MVC, non-blocking Spring Webflux and Go. The calls were created on Apache JMeter using a group of 200, 1000, 2000, 5000 concurrent users and response times in 10, 100, 200, 400, 800 milliseconds.
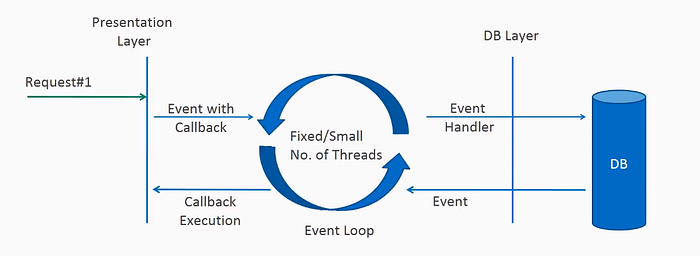
A brief explanation on topics how concurrency works in blocking and non-blocking API.
Blocking API
- Synchronous
- Servlet API
- One thread per request.
- Thread is blocked until the taks is completed.

Non-Blocking API
- Asynchronous.
- Non-Blocking API (Servlet 3.1+).
- Reactive Streams.
- Lot of connections with small number of threads.
Tests
Three applications were created in order to show the capacity of throughput.
Each application is running on a different port, all of them receive a parameter called delay expressed in milliseconds to simulate the time of the response that can be a query on database, a call to another API, external resource and so on.
Every call on Spring MVC, Spring Webflux or Go, returns the same payload. It's a simple product list with five items: id as integer, name and description as string and the price as decimal.

Apache JMeter
The Apache JMeter was the tool chosen to performe massive concurrent calls on endpoint APIs. It's a great way to measure application performance and it's behaviour.
Configuration
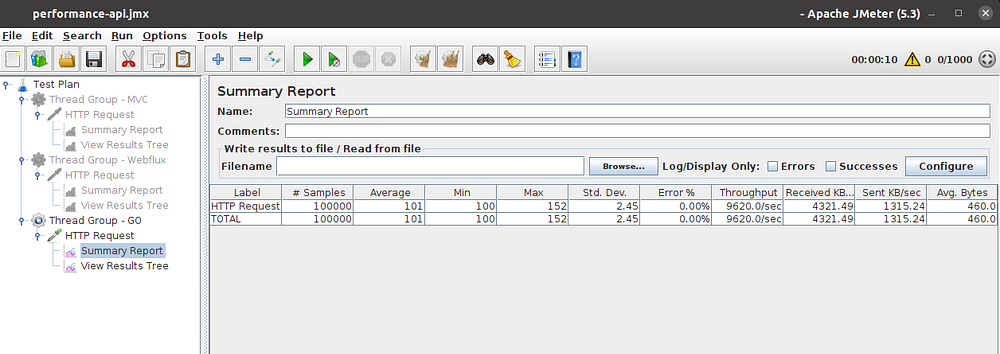
As you can see in the image below, you can specify the number of users and how many cycles you want to execute on the loop count.

Analysis
There are a lot of useful information provided on Summary Report like average, min, max response time. We are going to focus on throughput information.
Tests
The testes were divided in groups of 200, 1000, 2000 and 5000 users making calls on the GET endpoint API that returns a list of products.
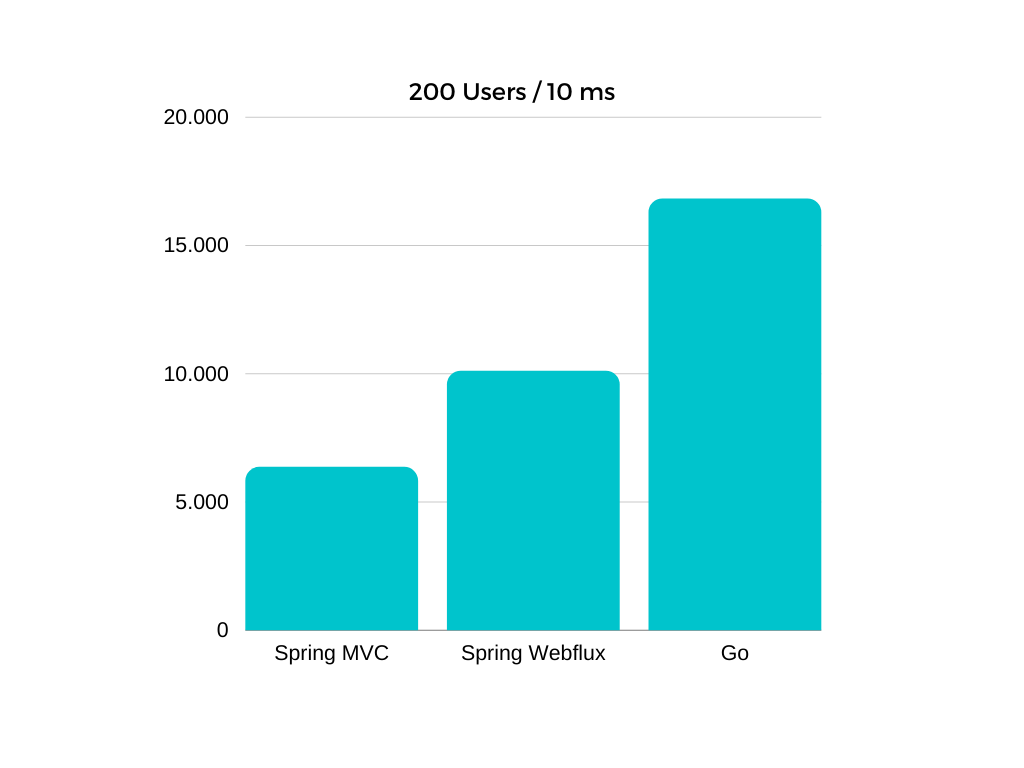
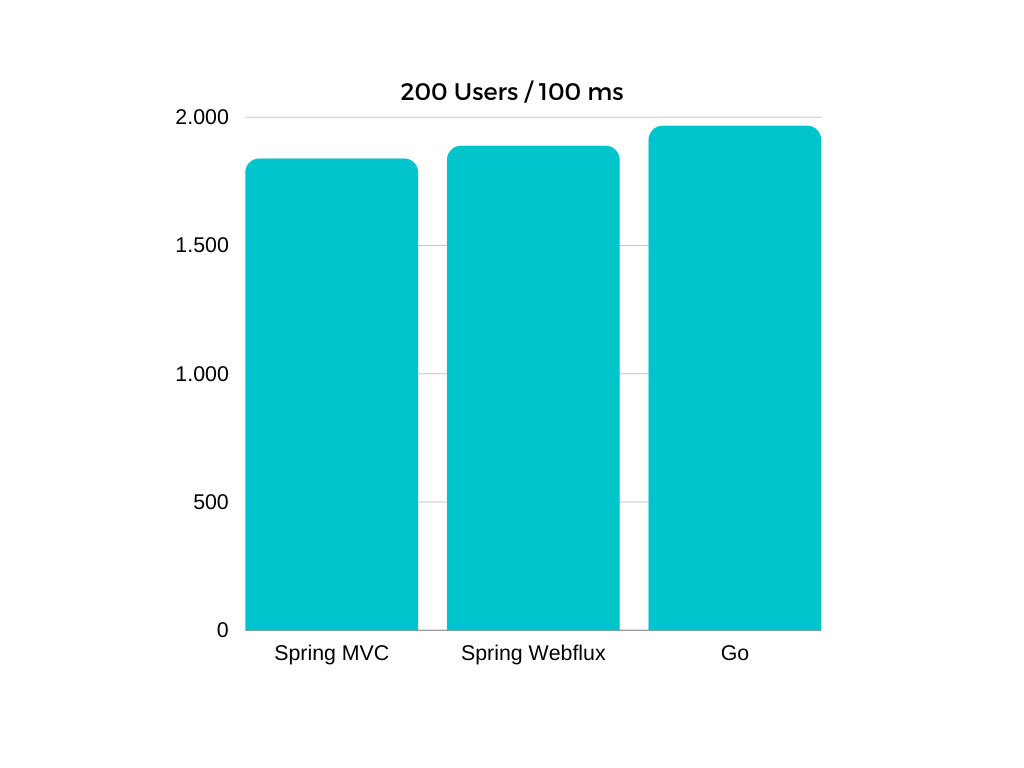
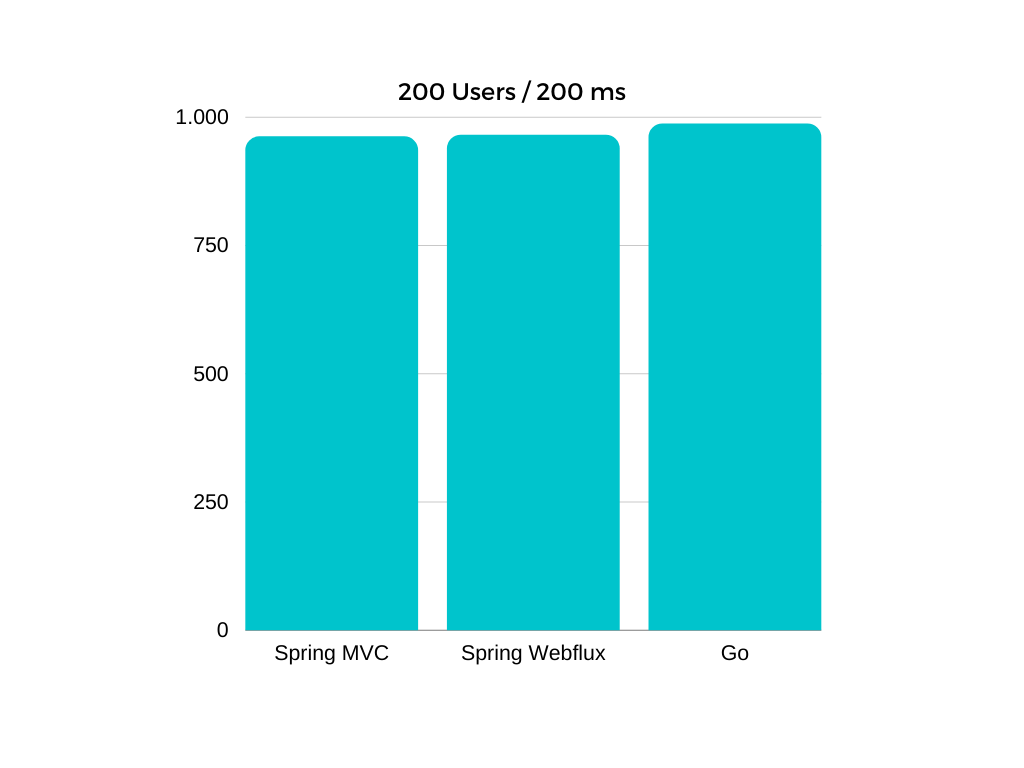
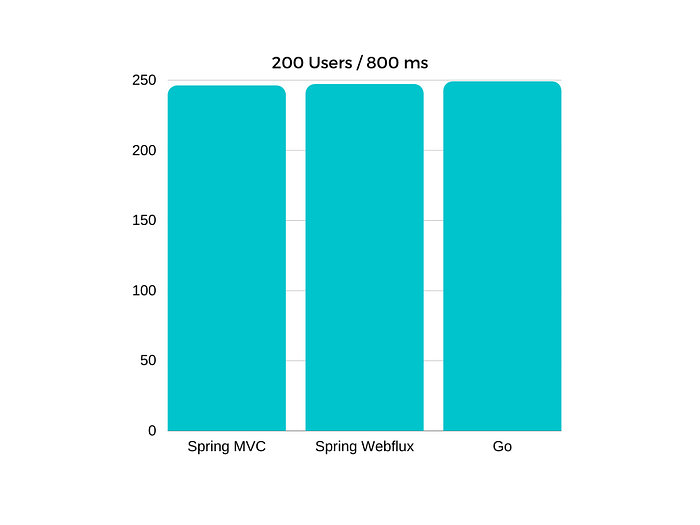
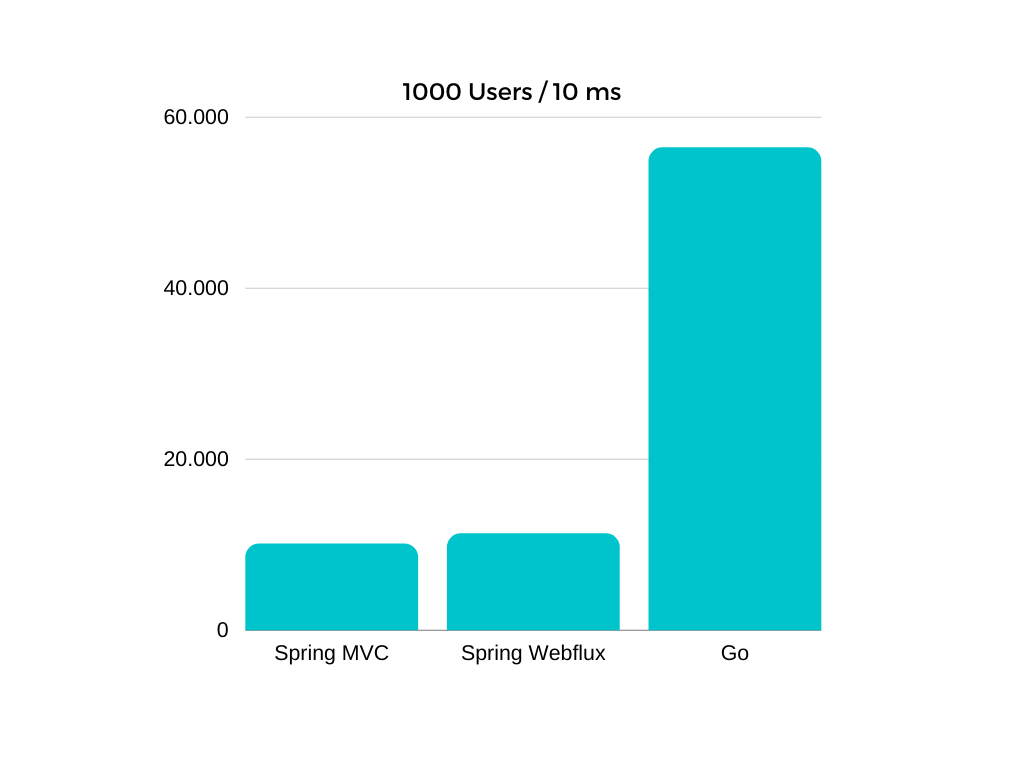
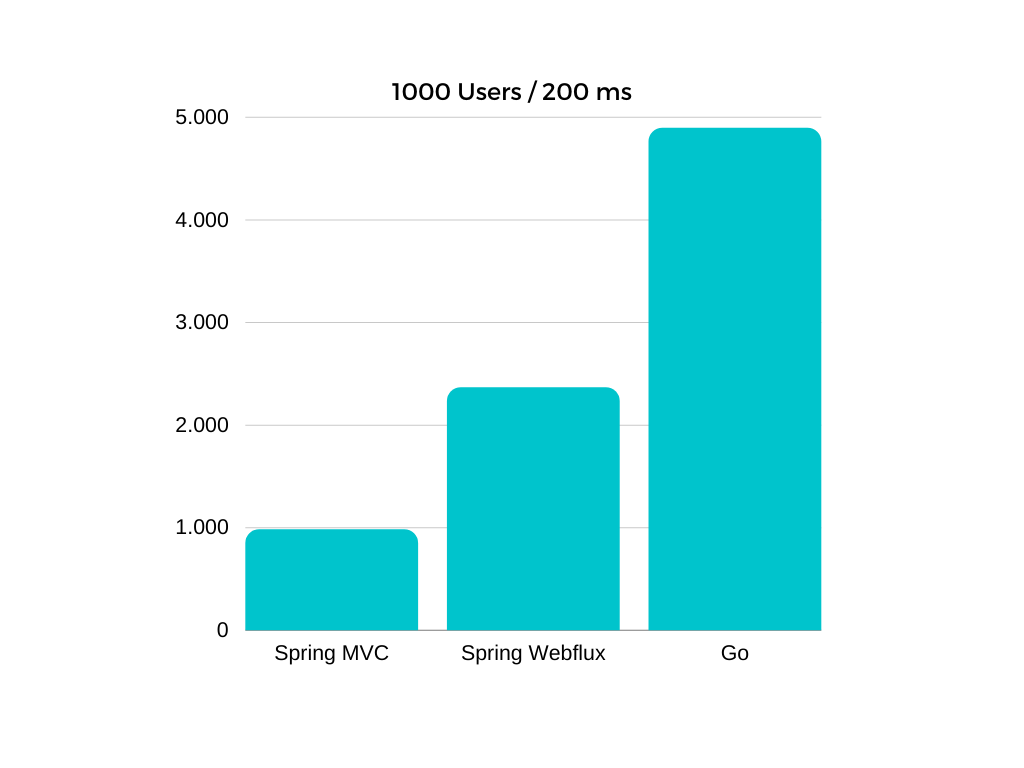
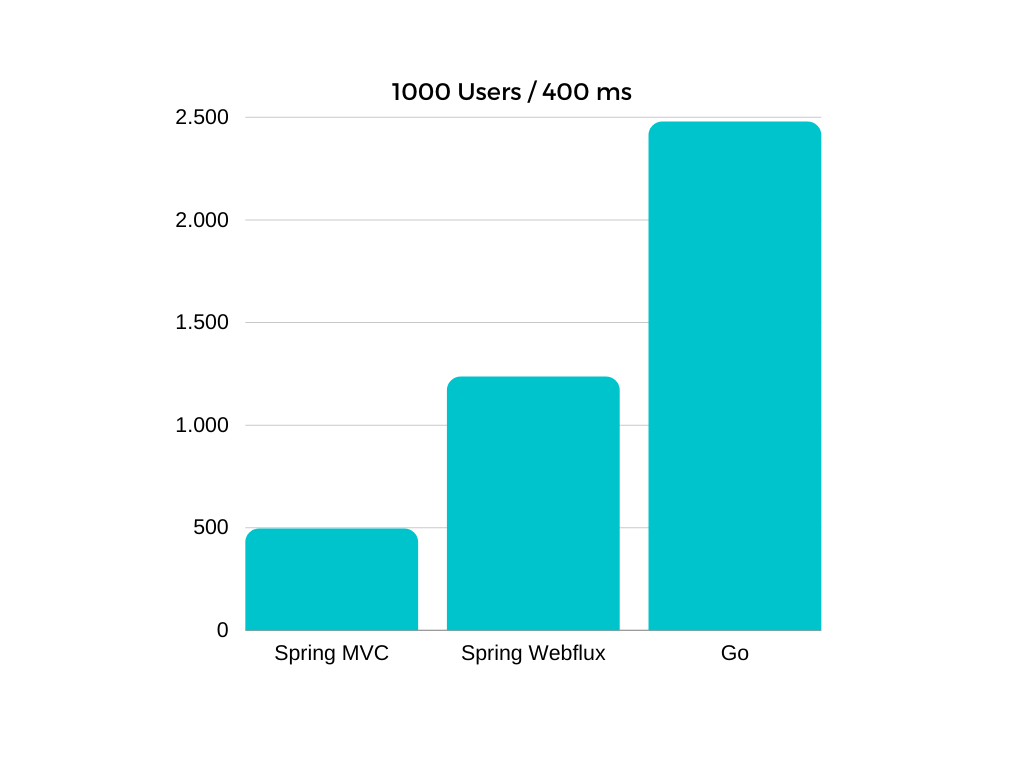
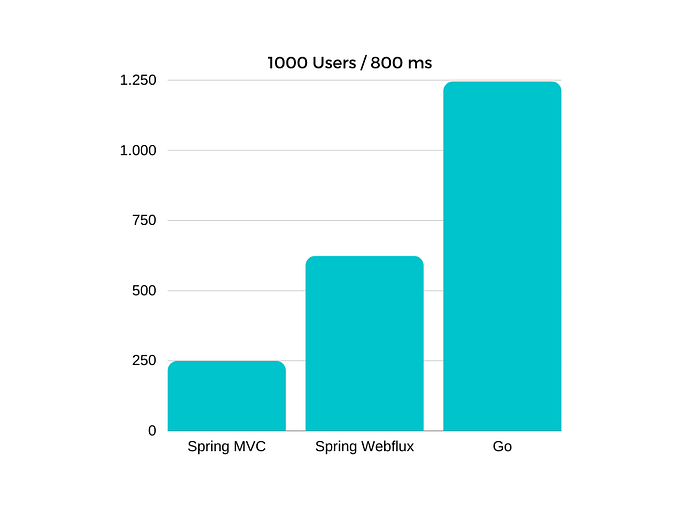
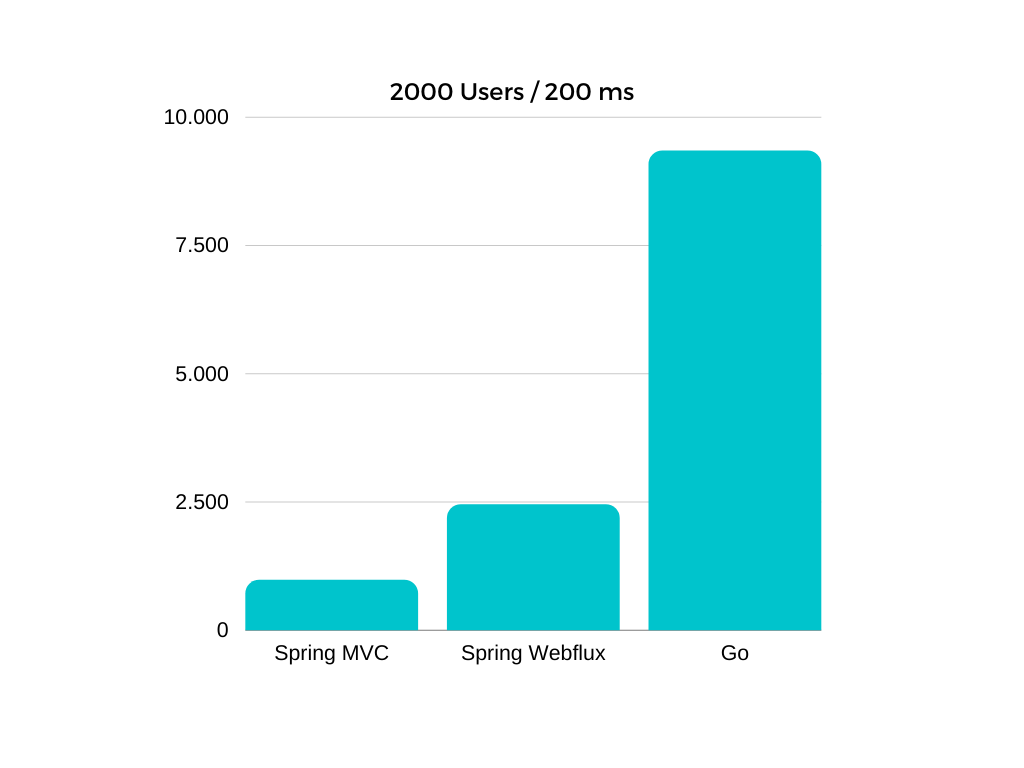
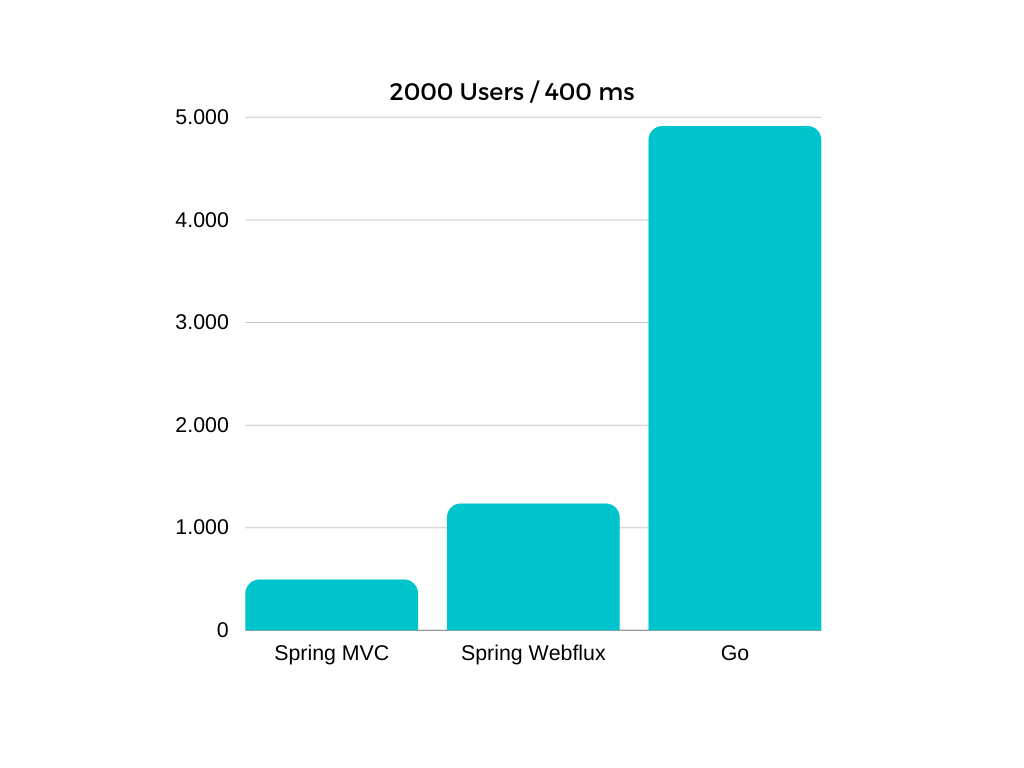
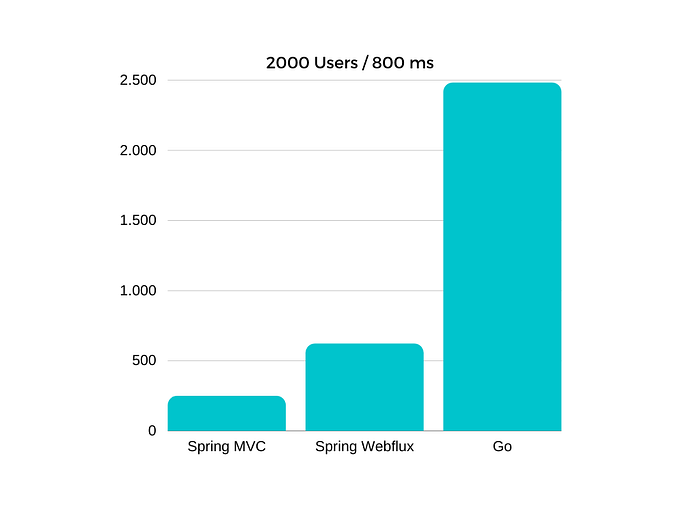
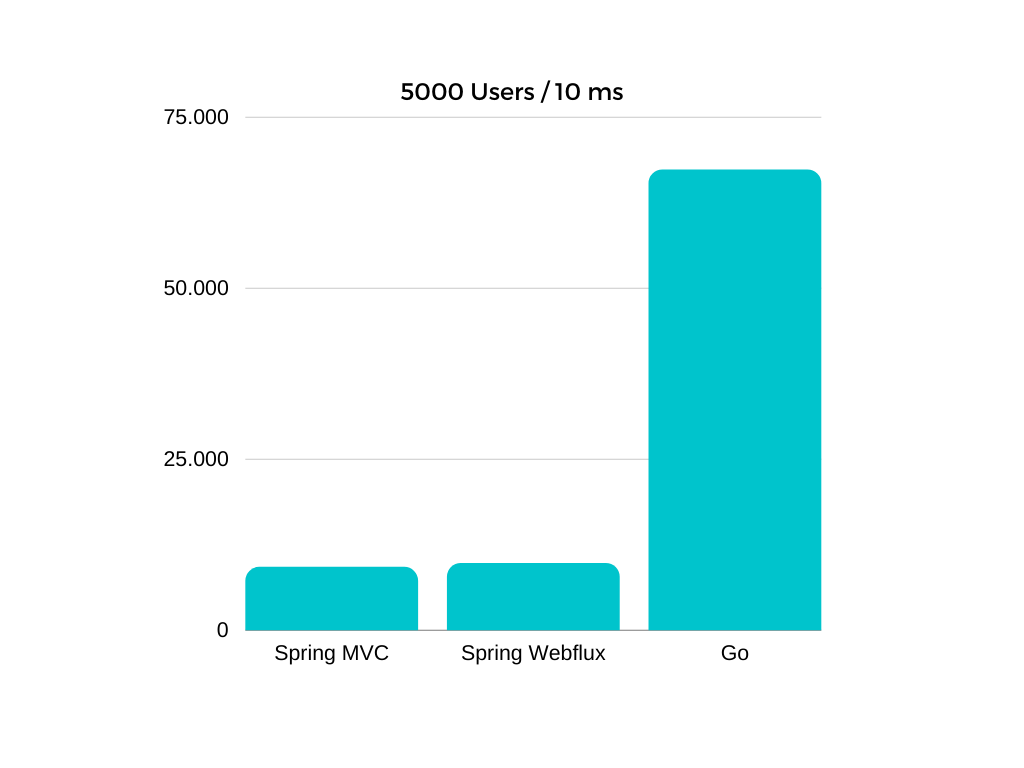
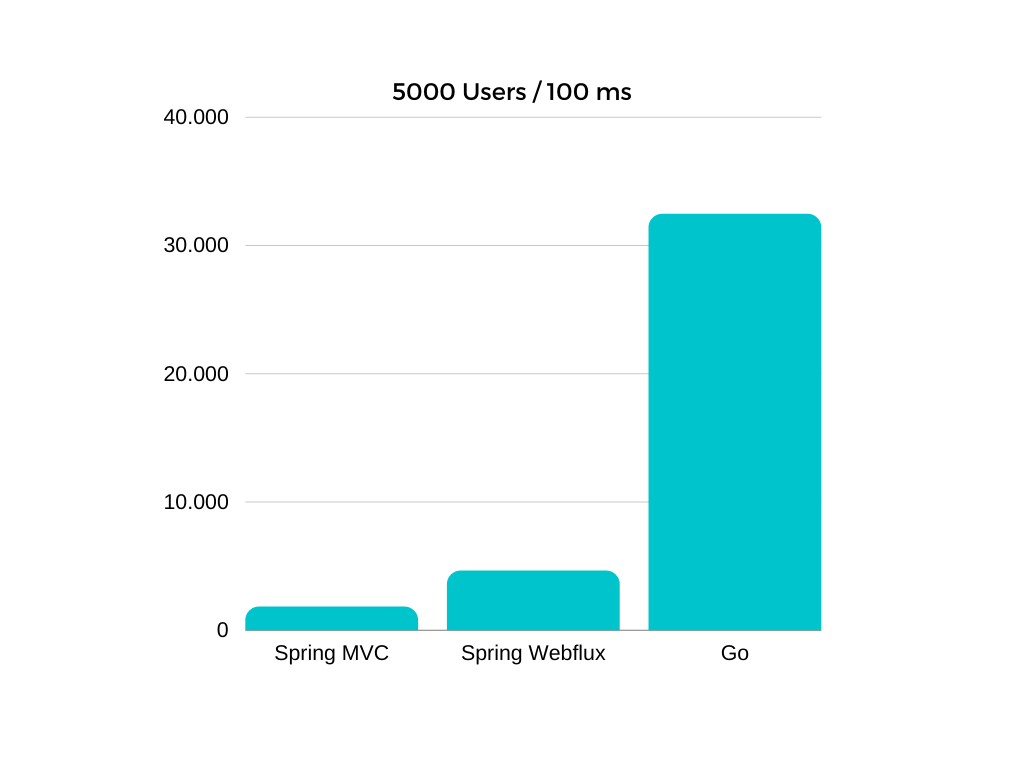
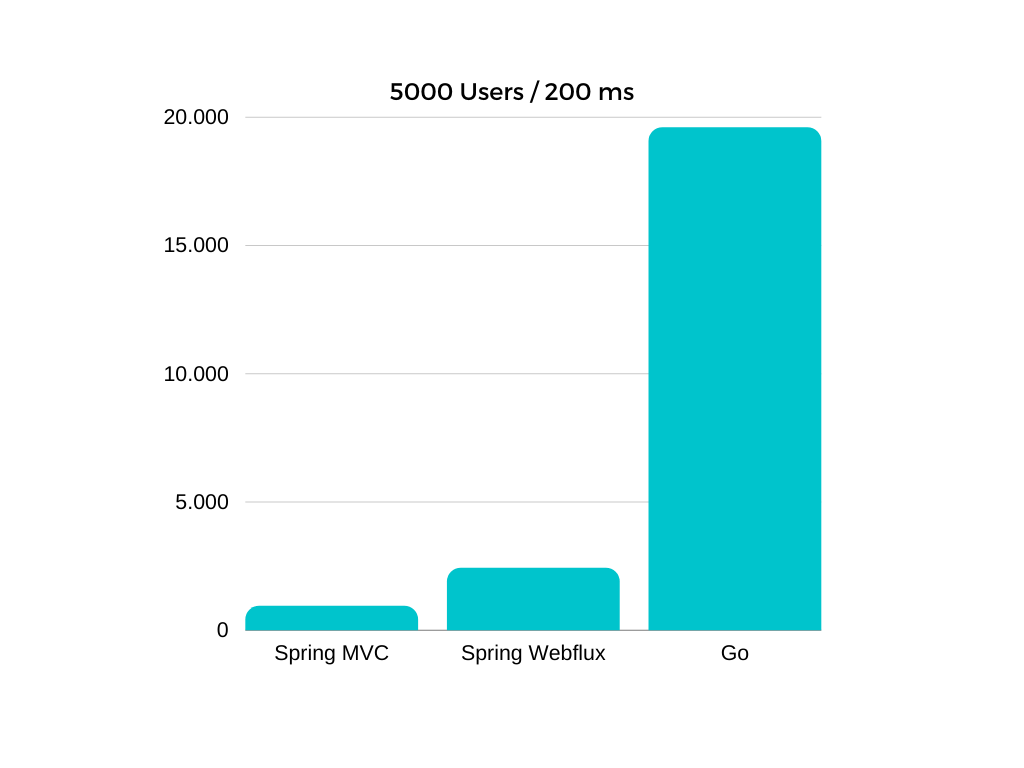
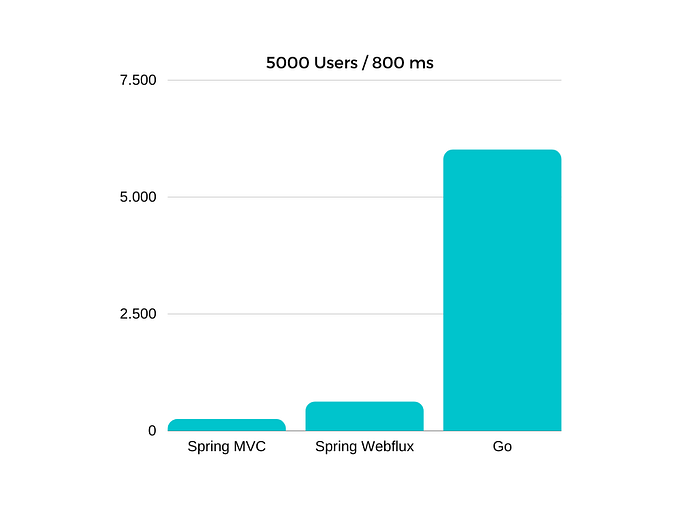
In Axis X are the technologies running the application and Axis Y is the throughput of each application
URLs
Each application are using a specific port and context, using a parameter delay to emulate a task.
Spring MVC
http://localhost:8081/performance-mvc/?delay=100
Spring Webflux
http://localhost:8082/performance-webflux/?delay=100
Go
http://localhost:8083/performance-go/?delay=100
Group of 200 users
This is a group of 200 concurrent users.
Max performance: Go
10ms = 16820 req/s
100ms = 1965 req/s
200ms = 987 req/s
400ms = 498 req/s
800ms = 249 req/s

Group of 1000 users
This is a group of 1000 concurrent users.
Max performance: Go
10ms = 56433 req/s
100ms = 8700 req/s
200ms = 4895 req/s
400ms = 2478 req/s
800ms = 1244 req/s

Group of 2000 users
This is a group of 2000 concurrent users.
Max performance: Go
10ms = 58105 req/s
100ms = 16727 req/s
200ms = 9345 req/s
400ms = 4911 req/s
800ms = 2481 req/s


Group of 5000 users
This is a group of 5000 concurrent users.
Max performance: Go
10ms = 67294 req/s
100ms = 32450 req/s
200ms = 19594 req/s
400ms = 11112 req/s
800ms = 6009 req/s

Source Code
You can find the source code of this 3 applications and the Apache JMeter file on the link below.
Conclusion
We could observe that in low number of requisitions in a time that proccess greater than 10 ms, application tend to have similiar behaviour. Otherwise in a massive number of concurring calls at the same time, Go performed way better reaching 67294 req/s.
Thanks for reading.